---
title: Increase your training ROI by up to 300% (step-by-step guide to identify L&D metrics that matter)
description: Learn how to effectively measure the ROI of Learning and Development programs by selecting and tracking the right metrics.
image: https://blog.oppida.co/hubfs/engagement%20and%20retention%20in%20education.png
---
25/06/2024
# Increase your training ROI by up to 300% (step-by-step guide to identify L&D metrics that matter)
[ Oppida Team ](https://blog.oppida.co/author/oppida-team)
Share: [facebook-f icon ](http://www.facebook.com/share.php?u=https://blog.oppida.co/roi-of-learning-and-development-programs) [linkedin-in icon ](http://www.linkedin.com/shareArticle?mini=true&url=https://blog.oppida.co/roi-of-learning-and-development-programs) [Twitter icon ](https://twitter.com/intent/tweet?url=https://blog.oppida.co/roi-of-learning-and-development-programs) [pinterest-p icon ](http://pinterest.com/pin/create/link/?url=https://blog.oppida.co/roi-of-learning-and-development-programs) [envelope icon ](mailto:?body=https://blog.oppida.co/roi-of-learning-and-development-programs)
Increase your training ROI by up to 300% (step-by-step guide to identify L&D metrics that matter)
7:16
Imagine you have invested time and resources into developing a comprehensive training program. How do you know if it’s really paying off? Understanding the return on investment (ROI) for learning and development (L&D) programs is crucial for organisations aiming to justify expenditures and [optimise training initiatives](https://blog.oppida.co/how-to-optimise-an-online-course-launch-strategy). Let’s explore how these metrics can be effectively measured and applied to the specific needs of an organisation.
## Training costs
First, let's talk about money. Training costs aren't just about the obvious expenses like trainer fees and materials. There are indirect costs too, like the time employees spend away from their usual tasks. For instance, if a company runs a week-long online training session using a virtual platform, they are covering more than just the platform and facilitator fees, factoring in the productivity dip from employees stepping away from their regular duties. Detailed financial records and time-tracking systems are essential for capturing all these training-related activities.
## Performance metrics

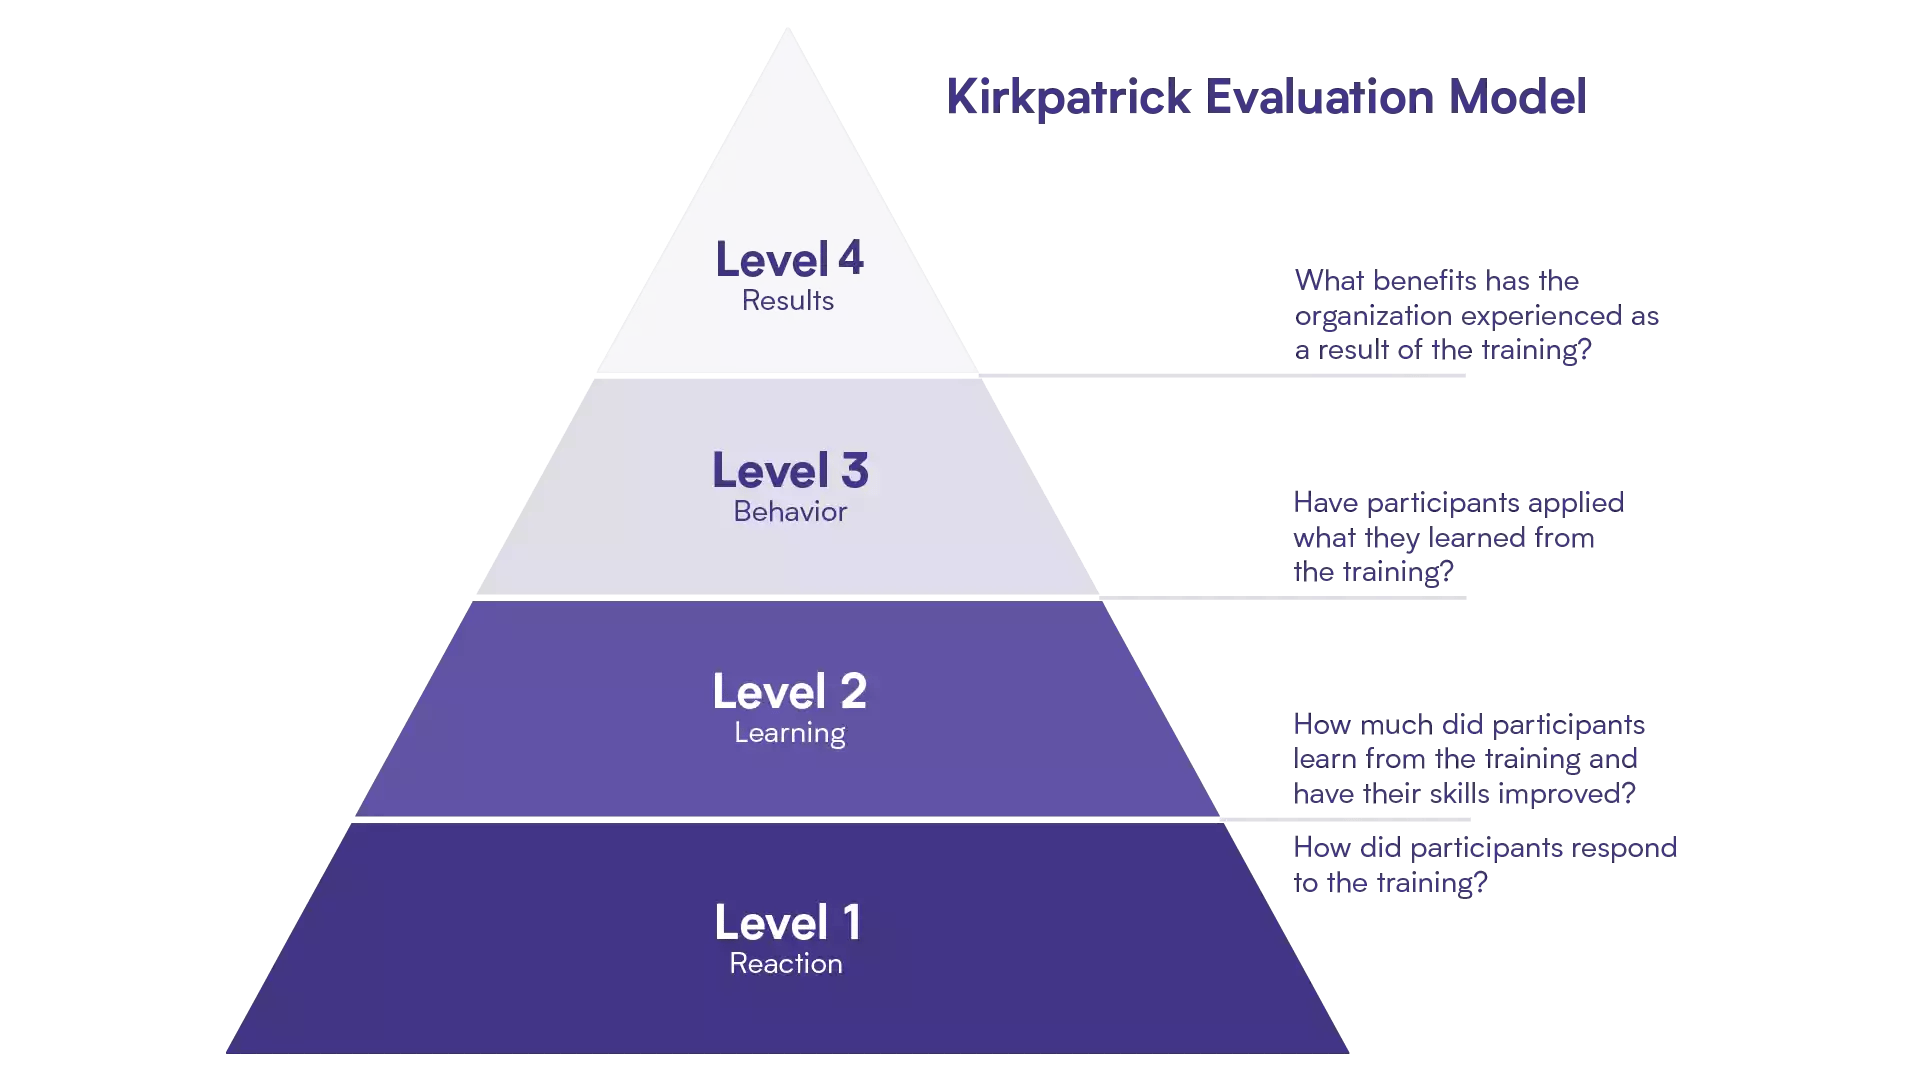
Performance metrics are about assessing the direct impact of training on job performance. Imagine an organisation rolls out a [blended learning](https://blog.oppida.co/blended-learning) program to enhance project management skills. By tracking project completion rates, adherence to timelines, and fewer project errors, there are clear signs of success. From there, regularly collecting and analysing this data with performance management systems would be crucial to continue progressing. Using Kirkpatrick’s Four Levels of Training Evaluation can help systematically assess the impact at different stages.
## Employee engagement and retention

Training can do wonders for employee engagement and retention. Surveys and feedback forms before and after training are useful for gauging this. For example, after employees participate in an online leadership development program, a follow-up survey could be used to see if they feel more connected to the company. Monitoring retention rates through HR records will allow the company to spot any changes in turnover post-training. Engaged employees are more likely to stick around, reducing recruitment and onboarding costs.
## Customer satisfaction
Customer satisfaction can show how effective training is, especially for customer-facing roles. Customer feedback tools like surveys and Net Promoter Scores (NPS) can be used to gather data. For instance, a new customer service e-learning module causing a surge in positive customer feedback and higher NPS scores. This means employees are applying their new skills effectively. Regular reviews of this data help assess long-term trends and the training's impact.
## Revenue impact
Training programs aimed at sales or customer service can directly boost revenue. Sales metrics like total sales, average transaction value, and conversion rates measure this impact. For example, if a sales team completes an advanced online sales techniques course, the company should see a rise in their sales figures and conversion rates. Using customer relationship management (CRM) systems to gather and analyse these metrics over time allows for clear comparison of pre- and post-training performance. Correlating these metrics with training activities helps pinpoint the training’s direct impact on revenue.
## Compliance and risk management
In industries with strict regulations, compliance training is a must. Compliance rates can be measured through audits and tracking systems to monitor adherence to regulations and internal policies. A drop in violations and legal issues post-training can highlight the program's effectiveness. Regular compliance checks and risk assessments are key for continuous improvement. For instance, after implementing a compliance training program via an online platform, a financial services company may observe a significant reduction in regulatory breaches.
## Innovation and problem-solving
Effective training can spur innovation and problem-solving. The number of new ideas, products, or services developed, and the time and resources spent on problem resolution, can all be measured by encouraging employees to document their innovative ideas and solutions in a shared online platform. For instance, after a virtual creativity workshop, a company might see an uptick in innovative project proposals or process improvements.
## Training effectiveness
To measure training effectiveness, pre- and post-training assessments along with participant feedback can be used. Participant feedback can be collected through online surveys to understand their perceptions of the training’s relevance and quality. This data helps refine future training sessions. For example, in a coding bootcamp conducted online, the participants were assessed on their coding skills before and after the course to measure improvement. Using learning analytics to track progress and engagement throughout the training is also recommended.
## Behavioural changes
Behavioural changes post-training can be observed through direct supervision and manager feedback. Managers should regularly monitor and report any noticeable improvements in employee behaviour that align with training objectives. Structured observation forms and regular check-ins ensure consistent and objective assessments. For example, after an online conflict resolution training, managers may observe a decrease in workplace conflicts.
## Career progression
Training often supports career development. Tracking promotion rates and skill utilisation are ways to measure this impact. HR systems can provide data on promotions and role changes, while performance reviews can highlight the application of new skills. It’s important to regularly review this data to ensure training programs align with career development goals. For example, after an online leadership training program, a company records the amount of participants promoted to managerial positions within a year.
## Calculating ROI
To calculate ROI, use the formula:

Net benefits are derived from the total benefits minus total costs. For example, if a training program costs $50,000 and results in $200,000 in increased productivity and reduced costs, the ROI calculation would be:

## Identifying relevant metrics
To figure out which metrics apply to an organisation, start by aligning the metrics with the business goals. If increasing sales is a priority, focus on performance metrics and revenue impact. For customer-centric roles, customer satisfaction and compliance metrics might be more relevant. It is important to engage stakeholders from various departments to gather input on which metrics best reflect the training's impact on their specific areas.
## Identifying relevant metrics by use case
| ### Use case | ### Relevant metrics | ### Measurement methods |
| --- | --- | --- |
| Cost tracking | Direct and indirect training costs | Financial records, time-tracking systems |
| Performance improvement | Productivity, efficiency, accuracy | Performance reports, efficiency assessments |
| Employee engagement | Engagement scores, retention rates | Surveys, HR records |
| Customer satisfaction | Customer feedback, net promoter score (NPS) | Customer surveys, NPS tracking |
| Revenue impact | Sales metrics, customer lifetime value (CLTV) | CRM systems, sales reports |
| Compliance | Compliance rates, incident reduction | Audits, compliance tracking systems |
| Innovation | Number of innovations, problem-solving effectiveness | Idea tracking platforms, project reports |
| Training effectiveness | Pre- and post-training assessments, participant feedback | Knowledge tests, participant surveys |
| Behavioural changes | Observed behavioural improvements, manager feedback | Structured observations, feedback sessions |
| Career progression | Promotion rates, skill utilisation | HR systems, performance reviews |
By using this table, one can better identify which metrics are most relevant to an organisation based on their specific goals and contexts. Implementing these metrics effectively will enable data-driven decisions, enhanced training programs, demonstrating their value to stakeholders.

[Working in educational design](https://blog.oppida.co/tag/working-in-educational-design)
## Related posts
[ ](https://blog.oppida.co/build-online-communities-through-digital-peer-assessment)
[Communities in education](https://blog.oppida.co/tag/communities-in-education), [Educational design strategies](https://blog.oppida.co/tag/educational-design-strategies), [Assessment in educational design](https://blog.oppida.co/tag/assessment-in-educational-design)
## [Build online communities that actually work using this 3-step peer assessment strategy](https://blog.oppida.co/build-online-communities-through-digital-peer-assessment)
[Oppida Team](https://blog.oppida.co/author/oppida-team)
16/09/2019
Ever fallen behind when taking an online course? Or, even worse, have you clicked through the...
[ Read more ](https://blog.oppida.co/build-online-communities-through-digital-peer-assessment)
[.png?height=200&name=How%20to%20modernise%20outdated%20online%20courses%20(in%204%20strategic%20steps).png) ](https://blog.oppida.co/how-to-modernise-outdated-online-courses)
[Educational design strategies](https://blog.oppida.co/tag/educational-design-strategies)
## [How to modernise outdated online courses (in 4 strategic steps)](https://blog.oppida.co/how-to-modernise-outdated-online-courses)
[Tyrone Staben](https://blog.oppida.co/author/tyrone-staben)
28/10/2025
Why course modernisation matters more than ever In 2020, universities and VET providers had no...
[ Read more ](https://blog.oppida.co/how-to-modernise-outdated-online-courses)
[ ](https://blog.oppida.co/designing-the-perfect-rubric)
[Assessment in educational design](https://blog.oppida.co/tag/assessment-in-educational-design)
## [Design the perfect rubric in 7 easy steps (and boost learner performance instantly)](https://blog.oppida.co/designing-the-perfect-rubric)
[Oppida Team](https://blog.oppida.co/author/oppida-team)
2/09/2019
Rubric assessments change the design of a course because they fundamentally change how a learner...
[ Read more ](https://blog.oppida.co/designing-the-perfect-rubric)

```json
{
"@context" : "https://schema.org",
"@id" : "https://oppida.co/#organization",
"@type" : "Organization",
"address" : {
"@type" : "PostalAddress",
"addressCountry" : "AU",
"addressLocality" : "Adelaide",
"addressRegion" : "SA",
"postalCode" : "5000",
"streetAddress" : "Level 2, 70 Hindmarsh Square"
},
"areaServed" : {
"@type" : "Place",
"name" : "Global"
},
"contactPoint" : [ {
"@type" : "ContactPoint",
"areaServed" : "Global",
"availableLanguage" : [ "en" ],
"contactType" : "customer support",
"email" : "hello@oppida.co",
"url" : "https://oppida.co/contact"
} ],
"description" : "Oppida partners with entrusted leaders of learning to design structured, institution-grade capability that strengthens authority, builds human capability, and delivers meaningful real-world impact. Oppida works across strategic program design, course development, rich media production, and AI literacy for everyone.",
"founder" : {
"@id" : "https://oppida.co/#founder",
"@type" : "Person",
"name" : "Bianca Raby",
"sameAs" : [ "https://www.linkedin.com/in/biancaraby/", "https://www.youtube.com/@biancaraby" ],
"url" : "https://biancaraby.com/"
},
"hasOfferCatalog" : {
"@type" : "OfferCatalog",
"itemListElement" : [ {
"@type" : "Offer",
"itemOffered" : {
"@type" : "Service",
"description" : "A focused strategy engagement to clarify audience, purpose, outcomes, delivery direction, risks, and curriculum structure before development begins.",
"name" : "Strategic program design"
}
}, {
"@type" : "Offer",
"itemOffered" : {
"@type" : "Service",
"description" : "Online and blended course development for organisations that need rigorous, well-structured learning aligned to standards, capability outcomes, and long-term delivery.",
"name" : "Course development"
}
}, {
"@type" : "Offer",
"itemOffered" : {
"@type" : "Service",
"description" : "Purposeful video, animation, and interactive media designed to deepen understanding and strengthen learning experiences.",
"name" : "Rich media production"
}
}, {
"@type" : "Offer",
"itemOffered" : {
"@type" : "Service",
"description" : "LMS-ready AI literacy modules that build shared understanding, judgement, and responsible practice across organisations operating in regulated and complex environments.",
"name" : "AI literacy for everyone"
}
} ],
"name" : "Oppida services"
},
"knowsAbout" : [ "learning design", "strategic program design", "course development", "online learning", "blended learning", "instructional design", "rich media production", "video production for learning", "learning management systems", "EdTech ecosystems", "AI literacy", "AI capability development", "adult learning", "higher education", "workforce capability", "institutional learning strategy" ],
"logo" : {
"@id" : "https://oppida.co/#logo",
"@type" : "ImageObject",
"url" : "https://qtrypzzcjebvfcihiynt.supabase.co/storage/v1/object/public/base44-prod/public/9e523cb92_Logo_DarkPurple.png"
},
"name" : "Oppida",
"sameAs" : [ "https://www.linkedin.com/company/oppida/", "https://www.youtube.com/@oppidaco" ],
"slogan" : "Partnering with entrusted leaders of learning to elevate their impact",
"url" : "https://oppida.co/"
}
```
```json
{
"@context" : "https://schema.org",
"@id" : "https://oppida.co/#website",
"@type" : "WebSite",
"description" : "Oppida partners with entrusted leaders of learning to build benchmark-level capability through strategic program design, course development, rich media production, and AI literacy.",
"inLanguage" : "en",
"keywords" : [ "strategic program design", "course development", "learning design", "instructional design", "online course development", "blended learning", "rich media production", "video production for learning", "AI literacy", "AI capability", "LMS-ready learning", "adult learning", "higher education", "government capability", "regulated learning environments" ],
"name" : "Oppida",
"potentialAction" : {
"@type" : "SearchAction",
"query-input" : "required name=search_term_string",
"target" : "https://oppida.co/search?query={search_term_string}"
},
"publisher" : {
"@id" : "https://oppida.co/#organization"
},
"url" : "https://oppida.co/"
}
```
```json
{
"@context" : "https://schema.org",
"@id" : "https://blog.oppida.co/#blog",
"@type" : "Blog",
"description" : "Insights on learning design, course development, strategic capability building, rich media, AI literacy, and thoughtful practice in complex learning environments.",
"inLanguage" : "en",
"isPartOf" : {
"@id" : "https://oppida.co/#website"
},
"name" : "Oppida blog",
"publisher" : {
"@id" : "https://oppida.co/#organization"
},
"url" : "https://blog.oppida.co/"
}
```
```json
{
"@context" : "https://schema.org",
"@id" : "https://blog.oppida.co/roi-of-learning-and-development-programs#webpage",
"@type" : "WebPage",
"about" : {
"@id" : "https://oppida.co/#organization"
},
"breadcrumb" : {
"@id" : "https://blog.oppida.co/roi-of-learning-and-development-programs#breadcrumbs"
},
"description" : "Learn how to effectively measure the ROI of Learning and Development programs by selecting and tracking the right metrics.",
"inLanguage" : "en",
"isPartOf" : {
"@id" : "https://blog.oppida.co/#blog"
},
"mainEntity" : {
"@id" : "https://blog.oppida.co/roi-of-learning-and-development-programs#article"
},
"name" : "Increase your training ROI by up to 300% (step-by-step guide to identify L&D metrics that matter)",
"primaryImageOfPage" : {
"@id" : "https://blog.oppida.co/roi-of-learning-and-development-programs#primaryimage"
},
"publisher" : {
"@id" : "https://oppida.co/#organization"
},
"url" : "https://blog.oppida.co/roi-of-learning-and-development-programs"
}
```
```json
{
"@context" : "https://schema.org",
"@id" : "https://blog.oppida.co/roi-of-learning-and-development-programs#primaryimage",
"@type" : "ImageObject",
"url" : "https://22642683.fs1.hubspotusercontent-na1.net/hubfs/22642683/engagement%20and%20retention%20in%20education.png"
}
```
```json
{
"@context" : "https://schema.org",
"@id" : "https://blog.oppida.co/roi-of-learning-and-development-programs#breadcrumbs",
"@type" : "BreadcrumbList",
"itemListElement" : [ {
"@type" : "ListItem",
"item" : "https://oppida.co/",
"name" : "Home",
"position" : 1
}, {
"@type" : "ListItem",
"item" : "https://blog.oppida.co/",
"name" : "Blog",
"position" : 2
}, {
"@type" : "ListItem",
"item" : "https://blog.oppida.co/roi-of-learning-and-development-programs",
"name" : "Increase your training ROI by up to 300% (step-by-step guide to identify L&D metrics that matter)",
"position" : 3
} ]
}
```
```json
{
"@context" : "https://schema.org",
"@id" : "https://blog.oppida.co/roi-of-learning-and-development-programs#article",
"@type" : "BlogPosting",
"articleSection" : [ "Working in educational design" ],
"author" : {
"@id" : "https://blog.oppida.co/author/oppida-team#author",
"@type" : "Person",
"name" : "Oppida Team",
"url" : "https://blog.oppida.co/author/oppida-team",
"worksFor" : {
"@id" : "https://oppida.co/#organization"
}
},
"dateModified" : "2026-02-18T04:24:37+0000",
"datePublished" : "2024-06-25T06:20:37+0000",
"description" : "Learn how to effectively measure the ROI of Learning and Development programs by selecting and tracking the right metrics.",
"headline" : "Increase your training ROI by up to 300% (step-by-step guide to identify L&D metrics that matter)",
"image" : {
"@id" : "https://blog.oppida.co/roi-of-learning-and-development-programs#primaryimage"
},
"inLanguage" : "en",
"isAccessibleForFree" : true,
"isPartOf" : {
"@id" : "https://blog.oppida.co/#blog"
},
"keywords" : [ "Working in educational design" ],
"mainEntityOfPage" : {
"@id" : "https://blog.oppida.co/roi-of-learning-and-development-programs#webpage"
},
"publisher" : {
"@id" : "https://oppida.co/#organization"
},
"url" : "https://blog.oppida.co/roi-of-learning-and-development-programs",
"wordCount" : 1144
}
```
```json
{
"@context" : "https://schema.org",
"@id" : "https://oppida.co/author/oppida-team",
"@type" : "Person",
"image" : {
"@id" : "https://oppida.co/author/oppida-team#image",
"@type" : "ImageObject",
"url" : "https://oppida.co/hubfs/default-avatar.png"
},
"name" : "Oppida Team",
"url" : "https://oppida.co/author/oppida-team",
"worksFor" : {
"@id" : "https://oppida.co/#organization"
}
}
```
```json
{
"@context" : "https://schema.org",
"@id" : "https://blog.oppida.co/roi-of-learning-and-development-programs#breadcrumb",
"@type" : "BreadcrumbList",
"itemListElement" : [ {
"@type" : "ListItem",
"item" : "https://oppida.co/",
"name" : "Home",
"position" : 1
}, {
"@type" : "ListItem",
"item" : "https://blog.oppida.co/",
"name" : "Blog",
"position" : 2
}, {
"@type" : "ListItem",
"name" : "Increase your training ROI by up to 300% (step-by-step guide to identify L&D metrics that matter)",
"position" : 3
} ]
}
```
```json
{
"@context" : "https://schema.org",
"@id" : "https://blog.oppida.co/roi-of-learning-and-development-programs#blogpost",
"@type" : "BlogPosting",
"about" : [ {
"@type" : "Thing",
"description" : "Articulate is a software company that develops e-learning authoring tools like Storyline and Rise.",
"name" : "Articulate",
"sameAs" : "https://en.wikipedia.org/wiki/Articulate_Global"
}, {
"@type" : "Thing",
"description" : "Artificial Intelligence in education refers to the use of AI technologies to enhance teaching and learning.",
"name" : "AI",
"sameAs" : "https://en.wikipedia.org/wiki/Artificial_intelligence_in_education"
} ],
"articleBody" : "Imagine you have invested time and resources into developing a comprehensive training program. How do you know if it’s really paying off? Understanding the return on investment (ROI) for learning and development (L&D) programs is crucial for organisations aiming to justify expenditures and optimise training initiatives. Let’s explore how these metrics can be effectively measured and applied to the specific needs of an organisation.
\n\nTraining costs
\nFirst, let's talk about money. Training costs aren't just about the obvious expenses like trainer fees and materials. There are indirect costs too, like the time employees spend away from their usual tasks. For instance, if a company runs a week-long online training session using a virtual platform, they are covering more than just the platform and facilitator fees, factoring in the productivity dip from employees stepping away from their regular duties. Detailed financial records and time-tracking systems are essential for capturing all these training-related activities.
\nPerformance metrics
\n
\nPerformance metrics are about assessing the direct impact of training on job performance. Imagine an organisation rolls out a blended learning program to enhance project management skills. By tracking project completion rates, adherence to timelines, and fewer project errors, there are clear signs of success. From there, regularly collecting and analysing this data with performance management systems would be crucial to continue progressing. Using Kirkpatrick’s Four Levels of Training Evaluation can help systematically assess the impact at different stages.
\n
\nEmployee engagement and retention
\n
\nTraining can do wonders for employee engagement and retention. Surveys and feedback forms before and after training are useful for gauging this. For example, after employees participate in an online leadership development program, a follow-up survey could be used to see if they feel more connected to the company. Monitoring retention rates through HR records will allow the company to spot any changes in turnover post-training. Engaged employees are more likely to stick around, reducing recruitment and onboarding costs.
\nCustomer satisfaction
\nCustomer satisfaction can show how effective training is, especially for customer-facing roles. Customer feedback tools like surveys and Net Promoter Scores (NPS) can be used to gather data. For instance, a new customer service e-learning module causing a surge in positive customer feedback and higher NPS scores. This means employees are applying their new skills effectively. Regular reviews of this data help assess long-term trends and the training's impact.
\nRevenue impact
\nTraining programs aimed at sales or customer service can directly boost revenue. Sales metrics like total sales, average transaction value, and conversion rates measure this impact. For example, if a sales team completes an advanced online sales techniques course, the company should see a rise in their sales figures and conversion rates. Using customer relationship management (CRM) systems to gather and analyse these metrics over time allows for clear comparison of pre- and post-training performance. Correlating these metrics with training activities helps pinpoint the training’s direct impact on revenue.
\nCompliance and risk management
\nIn industries with strict regulations, compliance training is a must. Compliance rates can be measured through audits and tracking systems to monitor adherence to regulations and internal policies. A drop in violations and legal issues post-training can highlight the program's effectiveness. Regular compliance checks and risk assessments are key for continuous improvement. For instance, after implementing a compliance training program via an online platform, a financial services company may observe a significant reduction in regulatory breaches.
\nInnovation and problem-solving
\nEffective training can spur innovation and problem-solving. The number of new ideas, products, or services developed, and the time and resources spent on problem resolution, can all be measured by encouraging employees to document their innovative ideas and solutions in a shared online platform. For instance, after a virtual creativity workshop, a company might see an uptick in innovative project proposals or process improvements.
\nTraining effectiveness
\nTo measure training effectiveness, pre- and post-training assessments along with participant feedback can be used. Participant feedback can be collected through online surveys to understand their perceptions of the training’s relevance and quality. This data helps refine future training sessions. For example, in a coding bootcamp conducted online, the participants were assessed on their coding skills before and after the course to measure improvement. Using learning analytics to track progress and engagement throughout the training is also recommended.
\nBehavioural changes
\nBehavioural changes post-training can be observed through direct supervision and manager feedback. Managers should regularly monitor and report any noticeable improvements in employee behaviour that align with training objectives. Structured observation forms and regular check-ins ensure consistent and objective assessments. For example, after an online conflict resolution training, managers may observe a decrease in workplace conflicts.
\nCareer progression
\nTraining often supports career development. Tracking promotion rates and skill utilisation are ways to measure this impact. HR systems can provide data on promotions and role changes, while performance reviews can highlight the application of new skills. It’s important to regularly review this data to ensure training programs align with career development goals. For example, after an online leadership training program, a company records the amount of participants promoted to managerial positions within a year.
\nCalculating ROI
\nTo calculate ROI, use the formula:
\n
\nNet benefits are derived from the total benefits minus total costs. For example, if a training program costs $50,000 and results in $200,000 in increased productivity and reduced costs, the ROI calculation would be:
\n
\nIdentifying relevant metrics
\nTo figure out which metrics apply to an organisation, start by aligning the metrics with the business goals. If increasing sales is a priority, focus on performance metrics and revenue impact. For customer-centric roles, customer satisfaction and compliance metrics might be more relevant. It is important to engage stakeholders from various departments to gather input on which metrics best reflect the training's impact on their specific areas.
\nIdentifying relevant metrics by use case
\n\n
\n\n\n\nUse case\n | \n\nRelevant metrics\n | \n\nMeasurement methods\n | \n
\n\n| \n Cost tracking \n | \n\n Direct and indirect training costs \n | \n\n Financial records, time-tracking systems \n | \n
\n\n| \n Performance improvement \n | \n\n Productivity, efficiency, accuracy \n | \n\n Performance reports, efficiency assessments \n | \n
\n\n| \n Employee engagement \n | \n\n Engagement scores, retention rates \n | \n\n Surveys, HR records \n | \n
\n\n| \n Customer satisfaction \n | \n\n Customer feedback, net promoter score (NPS) \n | \n\n Customer surveys, NPS tracking \n | \n
\n\n| \n Revenue impact \n | \n\n Sales metrics, customer lifetime value (CLTV) \n | \n\n CRM systems, sales reports \n | \n
\n\n| \n Compliance \n | \n\n Compliance rates, incident reduction \n | \n\n Audits, compliance tracking systems \n | \n
\n\n| \n Innovation \n | \n\n Number of innovations, problem-solving effectiveness \n | \n\n Idea tracking platforms, project reports \n | \n
\n\n| \n Training effectiveness \n | \n\n Pre- and post-training assessments, participant feedback \n | \n\n Knowledge tests, participant surveys \n | \n
\n\n| \n Behavioural changes \n | \n\n Observed behavioural improvements, manager feedback \n | \n\n Structured observations, feedback sessions \n | \n
\n\n| \n Career progression \n | \n\n Promotion rates, skill utilisation \n | \n\n HR systems, performance reviews \n | \n
\n\n
\n
By using this table, one can better identify which metrics are most relevant to an organisation based on their specific goals and contexts. Implementing these metrics effectively will enable data-driven decisions, enhanced training programs, demonstrating their value to stakeholders.
\n
\n
",
"audience" : {
"@type" : "Audience",
"audienceType" : [ "Educational Leaders", "Corporate L&D" ]
},
"author" : {
"@id" : "https://oppida.co/author/oppida-team"
},
"citation" : [ ],
"dateModified" : "2026-02-18T04:14:23.166Z",
"datePublished" : "2024-06-25T06:20:37Z",
"description" : "Increase your training ROI by up to 300% (step-by-step guide to identify L&D metrics that matter)",
"headline" : "Increase your training ROI by up to 300% (step-by-step guide to identify L&D metrics that matter)",
"image" : {
"@id" : "https://blog.oppida.co/roi-of-learning-and-development-programs#primaryimage",
"@type" : "ImageObject",
"height" : 630,
"url" : "https://22642683.fs1.hubspotusercontent-na1.net/hubfs/22642683/engagement%20and%20retention%20in%20education.png",
"width" : 1200
},
"keywords" : "",
"mainEntityOfPage" : {
"@id" : "https://blog.oppida.co/roi-of-learning-and-development-programs#webpage"
},
"mentions" : [ {
"@type" : "Thing",
"description" : "Articulate is a software company that develops e-learning authoring tools like Storyline and Rise.",
"name" : "Articulate",
"sameAs" : "https://en.wikipedia.org/wiki/Articulate_Global"
}, {
"@type" : "Thing",
"description" : "Artificial Intelligence in education refers to the use of AI technologies to enhance teaching and learning.",
"name" : "AI",
"sameAs" : "https://en.wikipedia.org/wiki/Artificial_intelligence_in_education"
} ],
"publisher" : {
"@id" : "https://oppida.co/#organization"
},
"wordCount" : 1109
}
```