In today's ever-evolving educational landscape, learning has transcended the confines of...
How to optimise student data visualisation (and save teachers hours of guesswork)
Octopus BI is a business analytics platform delivering insights through beautiful student data visualisation. Oppida’s CEO Bianca Raby sat down with Trevor Furness, the CRO (Chief Revenue Officer) to chat about how Octopus BI is helping schools and educational providers make sense of all the student data they have now that digital tools are the norm.

Bianca: Hi, Trevor. Thank you so much for joining me today. I’m really excited to hear more about Octopus BI, as data is a huge part of digital education institutions. So maybe we’ll just start with you explaining a little bit more about Octopus BI and student data visualisation for education providers.
Trevor: Yes, that’s my pleasure. Thanks so much for talking to me. Octopus BI was really conceived to deal with the fact that education institutions are collecting a growing mass of information and data from a number of different sources. Software has become easier to produce and deploy and, as a result, schools, educational institutions and universities are amassing very large digital ecosystems.
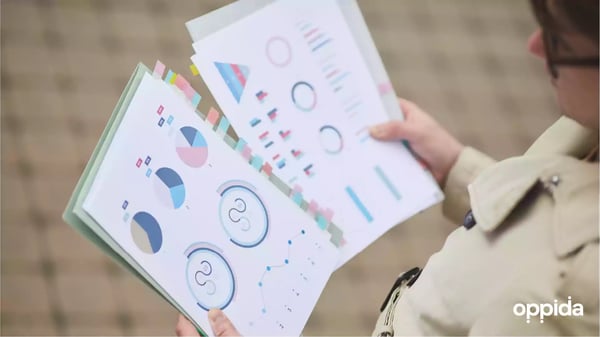
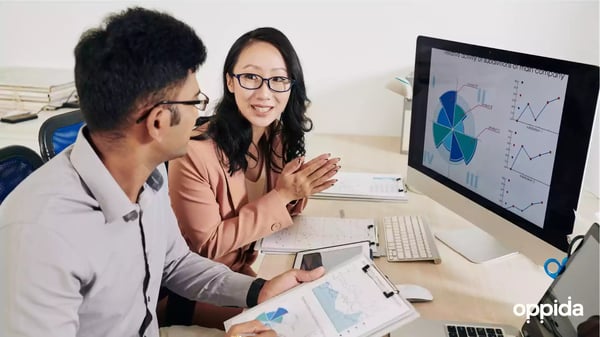
We recognised pretty early on that managing this ecosystem and driving value to end users is really challenging and really expensive. So fundamentally, what Octopus BI seeks to do is to connect to all of the data sources that exist inside the institution. We visualise that in beautiful and easy-to-read dashboards and we place those dashboards in a tool that aligns with an existing business process. Then you can think of a student information system, website, learning management system, or even a parent or student portal as a place to see your data rather than needing to log in to yet another system.
Challenges in managing student data
Bianca: Awesome. So what would be the biggest challenges that you have seen or faced in managing the student data effectively?
Trevor: Great question. I think the first one is that the expectation on the teacher is extraordinarily high to be data-informed without necessarily being provided for in terms of access to that data. What that means in practice is that a primary school teacher who is teaching 20-30 students, or a secondary teacher who is teaching several hundred students, would need to log into several different interfaces in order to get a decent picture of the learning for that student. I don’t believe that’s sustainable. As a result, the data isn’t being leveraged even though it’s there.
We see this as an extraordinarily missed opportunity, particularly for schools and institutions which have got an appetite around a transparent approach to feedback and reporting. There’s a huge opportunity for us based on the huge challenge that exists in those institutions.
Managing risk and inconsistency
Bianca: Absolutely. You mentioned that if it’s really that complicated, it’s left up to the teacher to do that work, and that’s obviously going to create inconsistencies.
Trevor: That’s right. It’s probably worth pointing out that there’s a huge risk to data privacy in this. What we don’t want to see is individual teachers going to a free trial of some amazing tool they found on the web, importing real data, and then distributing that outside of a ratified data strategy and a ratified distribution list. One of the big advantages for schools working with businesses like ours is to help mitigate the potential risks of data leakage.
Using student data visualisations
Bianca: For sure. Can you tell us about a client who’s been able to use the data visualisation that Octopus BI has aggregated in a meaningful way?
Trevor: There are lots of those. I’ll pick a school in South Australia. It’s a state school. They have about a thousand students and they have very diverse language, learning abilities, and cultural backgrounds. It also happens to be in a very low socio-economic section of Adelaide.
We’re essentially engaging with parents. Engaging with parents has been really challenging for the school. Octopus BI is working with data from the student information system and the learning management system to help create student profiles and reporting. These can be produced in pdf’s for those parents to really get access to student progression. The school is going one step further for those students who don’t have reliable access to internet services. They print out student profile dashboards from our service and make them available at reception for parents who are unable to access them in any other way, so they can get a physical copy of that student’s progress. We’re thrilled to be able to connect to a community as diverse as that and to be able to service them with our product.

Future developments in digital education
Bianca: Awesome. One of the last questions I ask all of my interviewees is, what you are excited about in digital education?
Trevor: I think the excitement is around the potential for artificial intelligence and machine learning to interact with data for us – the idea that even data aggregated like ours can take an additional step with AI to start to recommend content, to start to recommend action, and to recognise the insight. It’s essentially moving away from the need for human interaction with data sets and dashboards. It will be much more around the data communicated directly with the end user, telling them about what’s happening, what the prediction is, and essentially the insight that forms action to take in order to essentially change the future based on the very early indicators that we have been getting. I’m hugely excited about that. Data has a place to play with that. And I think we’re not done on the technology advancement side in order to make that a reality, but we’re definitely taking steps toward prediction models to get us to that point.
Bianca: Right. So that computers can do the legwork and humans can do what we’re good at, and that’s a problem solved?
Trevor: Yes, I think we have actually really nailed that, Bianca. One of the things that I love to talk about, having spent some time in a classroom myself, is that fundamentally, what we don’t want to remove is the thing that makes teaching and learning so special, which is the human interaction part. The more we can leverage technology to do the things that humans aren’t necessarily that great at, the more time we free up in a teacher’s day to spend that time – in a data-informed context – really having that human interaction phase fully-fledged.
Bianca: Fantastic. Thank you so much for joining me today and with the work you’re doing with Octopus BI. I can’t wait to see how you grow and how many more schools can get access to a great data set.
Trevor: That’s my pleasure. Thanks so much for your time, Bianca. I really appreciate it.


